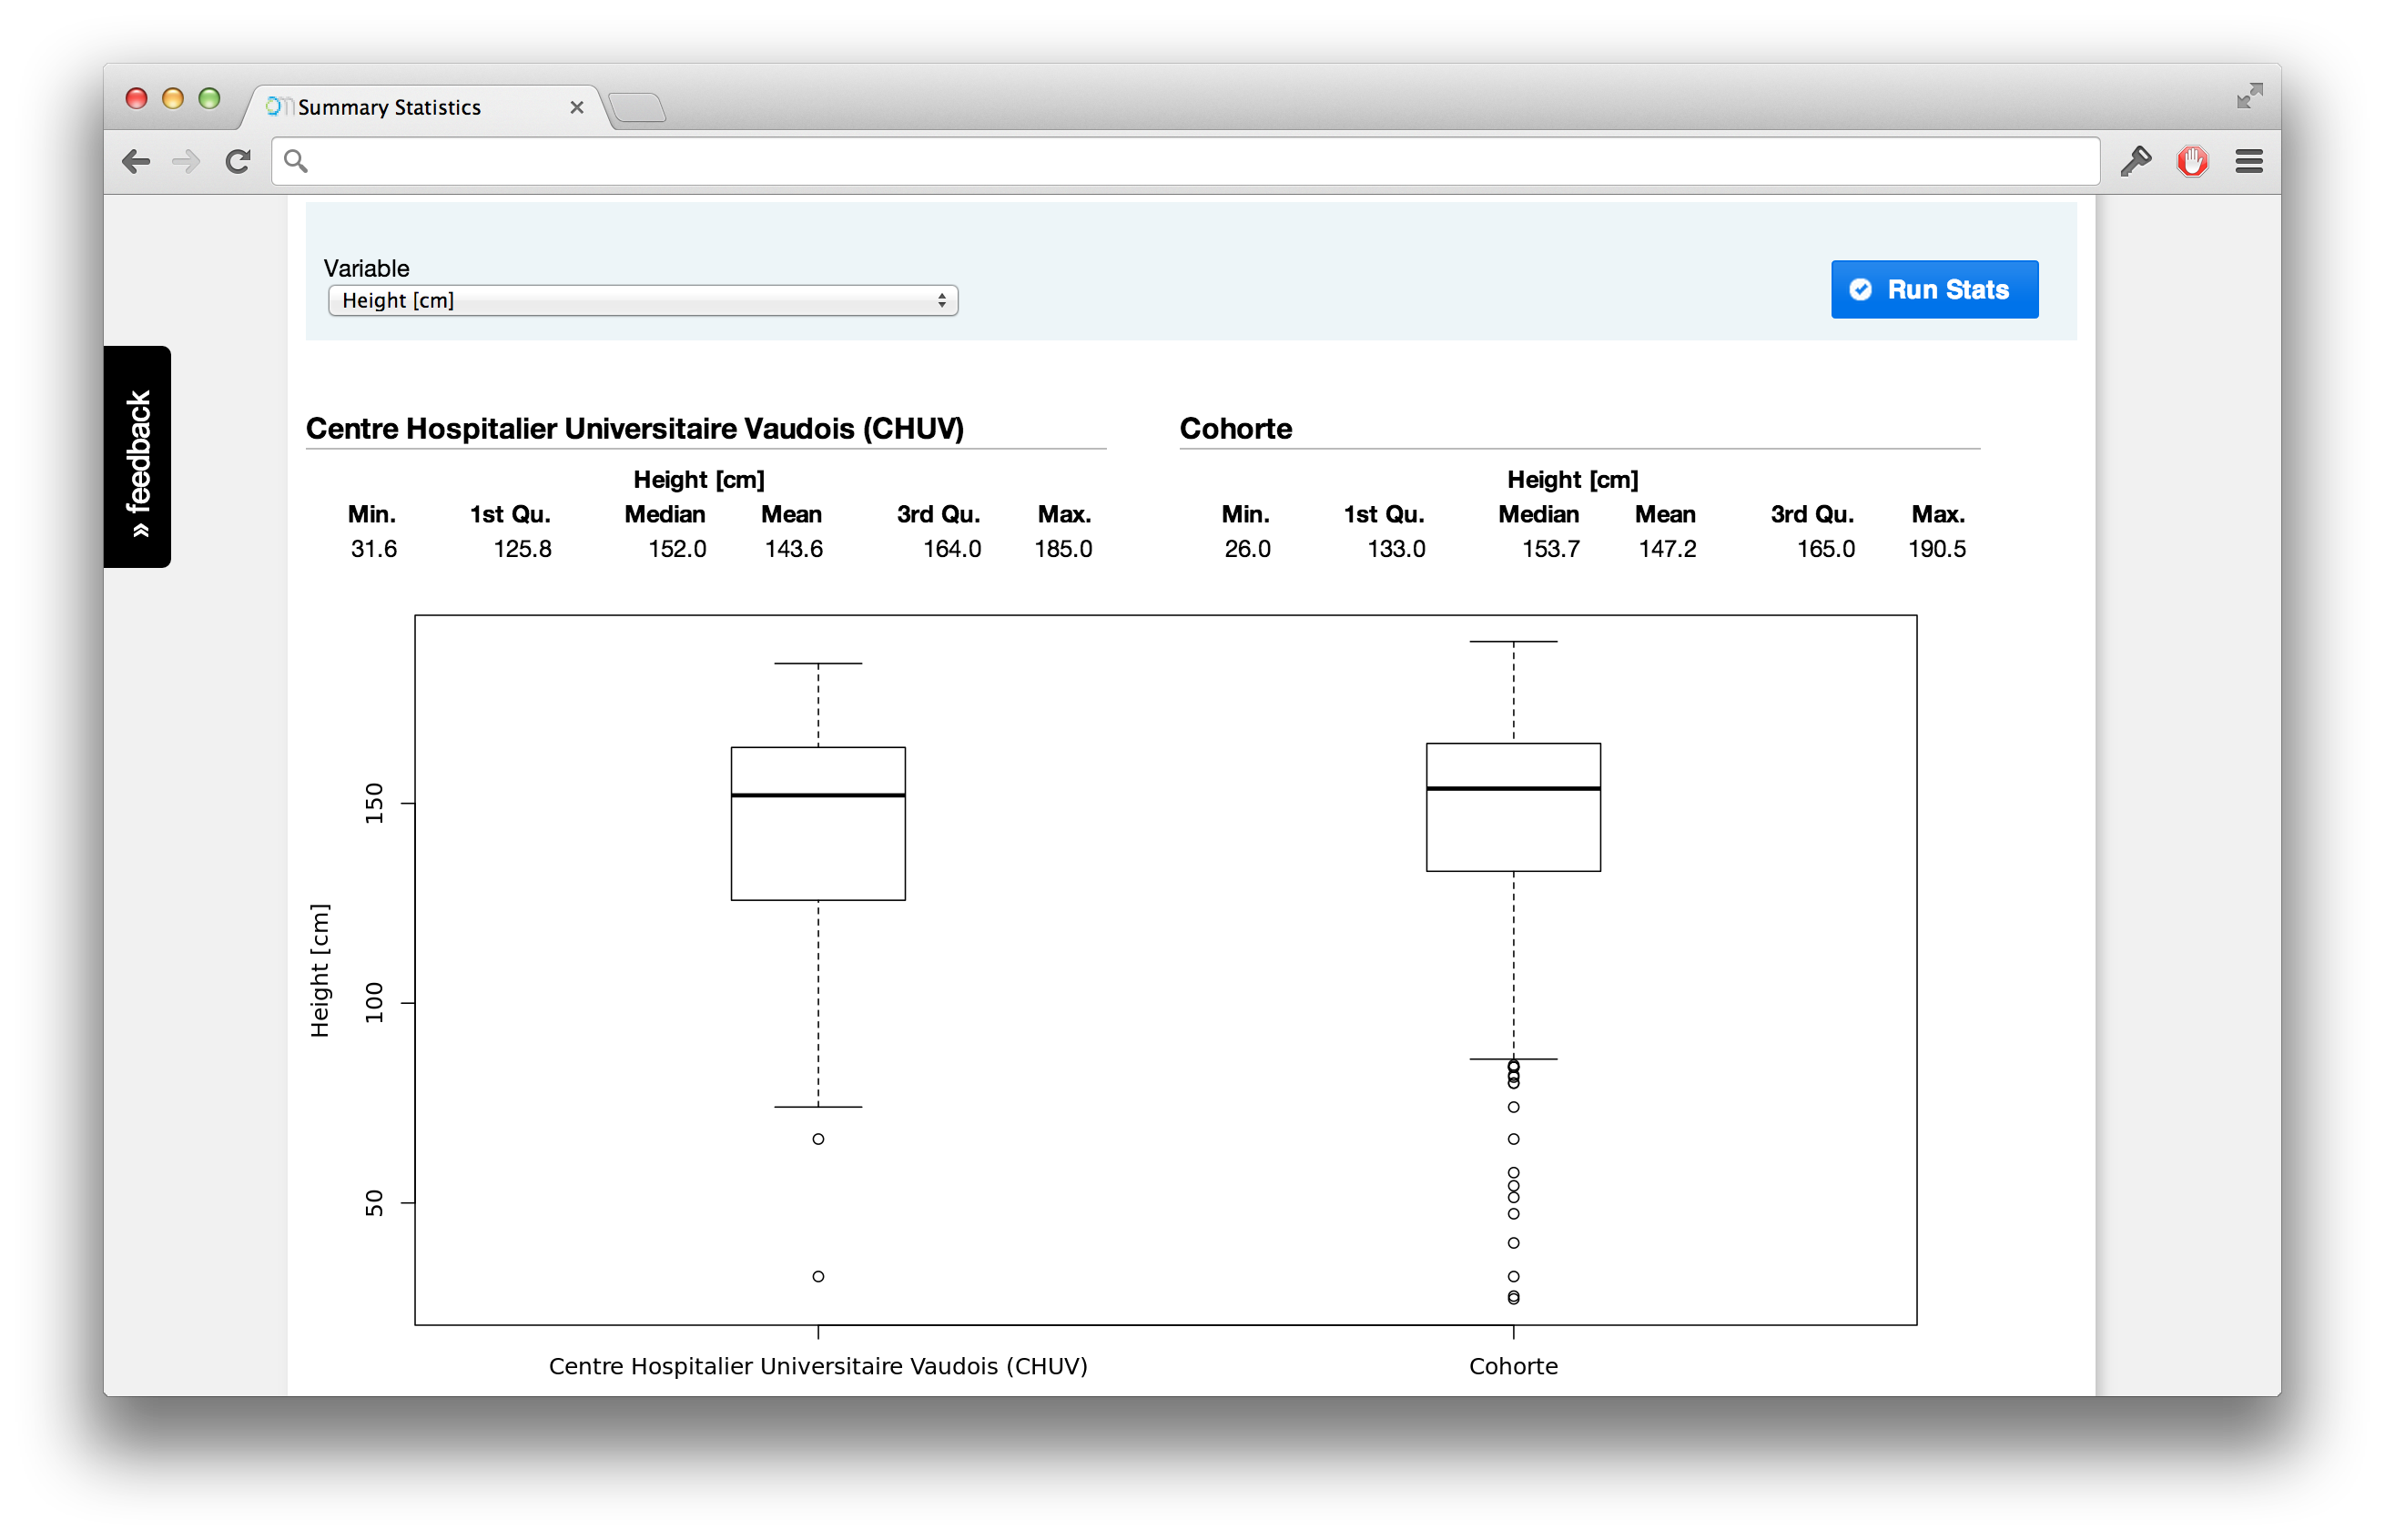
OCQMS now offers some basic summary statistics for realtime explorative data analysis. Below you see a boxplot chart for a certain institution in comparison to all cohort data. The charts can also help to discover outliers and correct erroneous values if needed.
The summary statistics are implemented using the open source statistical programming language R (www.r-project.org).